Get a clear, accurate view of your business finances with Neat’s financial reports. Use reports like Profit & Loss, Balance Sheet, Cash Flow, and detailed transaction reports to understand income and expenses, monitor cash movement, and assess your overall financial health. These reports help you stay informed, make confident decisions, and be prepared for tax time or financial reviews.
To learn about ALL the available reports in Neat, check out our Reporting Overview Help Center article.
What types of finanical reports can I run in Neat?
There are several financial report types you can run in Neat. Financial reports can only be run on transactions in the 'Do My Books' section. Check out the list of available financial reports below:
Profit & Loss Statement: Also known as an Income Statement, the Profit & Loss report provides a clear summary of your company’s income and expenses over a specific time period. Use this report to understand profitability, track financial performance, and see where money is being earned and spent.
Balance Sheet: The Balance Sheet report shows your company’s financial health at a glance. By outlining assets, liabilities, and owner’s equity, it helps you assess stability, track changes over time, and make informed financial decisions.
Cash Flow Statement: The Cash Flow Statement shows how cash moves in and out of your business over a specific time period. It summarizes cash inflows and outflows from operating, investing, and financing activities, helping you understand liquidity, manage cash on hand, and ensure your business can meet its financial obligations.
Transaction Detail: This report shows a detailed breakdown of transactions across your accounts, including money coming in and going out. It’s especially useful for reviewing activity, troubleshooting discrepancies, and supporting reconciliation or financial reviews.
How do I create a Profit & Loss Statement?
The following transaction categories from your My Categories list flow through to your P&L statement:
Income
Cost of Goods Sold
Expense
Please Note: Other Expenses & Non-Business Expenses from your My Categories list do not flow to your P&L statement.
First click Reports at the top right hand corner of Neat.
Under the Financial Reporting section click Profit & Loss Statment.
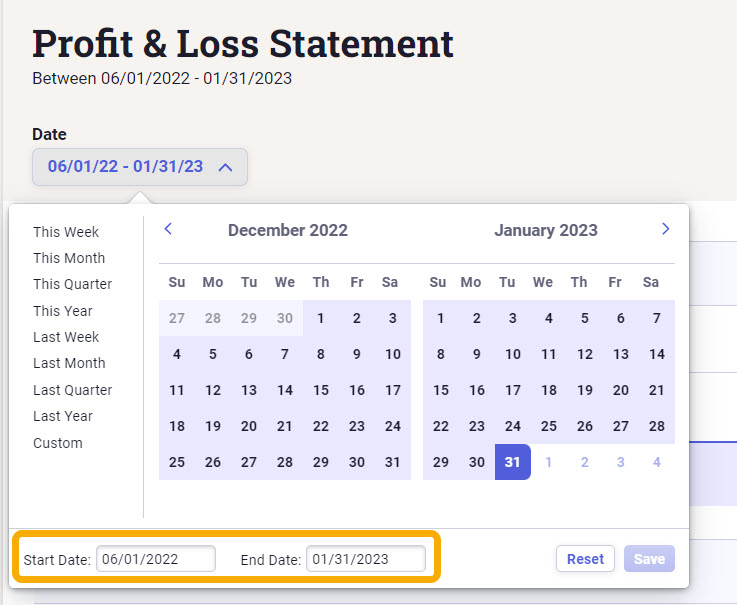
Adjust the statement's specified period by clicking on the date dropdown to the top left of the statement. In the calendars, choose the start date on the left, then set the end date on the right. Alternatively, you can type the Start and End Date below the calendars. Then click Save.
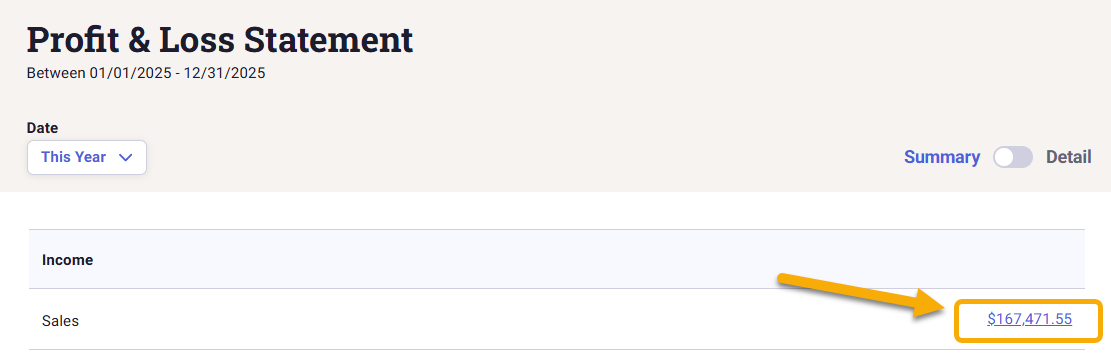
Toggle between a summary report, that shows you a basic summary of your P&L statement using your transaction parent categories, or a detailed report that provides a detailed breakdown using both your transaction parent categories and their child categories.
Click Export in the top right corner to export your statement to a PDF file, a CSV file, or to email the statement directly to your CPA or accountant.
Please Note: At this point, you cannot save a P&L statement in Neat. This is a feature enhancement that is coming soon. In the meantime, you can save a copy of the report in Neat by emailing a copy of your statement to your Neat Cloud email-in address.
Neat Pro Tip: Click the amount for any category to see a detailed list of transactions driving that amount.
How do I create a Balance Sheet?
The following transaction categories from your My Categories list flow through to balance sheet:
Assets
Liabilities
Equity
First click Reports at the top right hand corner of Neat.
Under the Financial Reporting section click Balance Sheet.
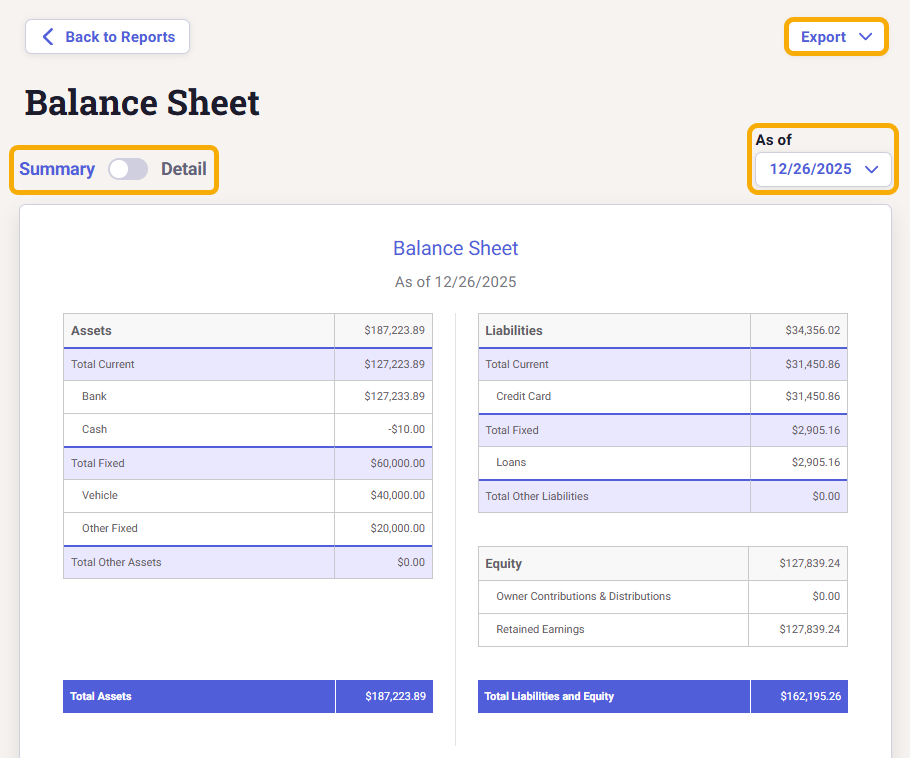
Adjust the sheet's date by clicking on the date dropdown to the top right of the statement.
Toggle between a summary report, that shows you a basic summary of your balance sheet using your transaction parent categories, or a detailed report that provides a detailed breakdown using both your transaction parent categories and their child categories.
Click Export at the top right corner to export your balance sheet to a PDF file, a CSV file, or to email the statement directly to your CPA or accountant.
Please Note: At this point, you cannot save a balance sheet in Neat. This is a feature enhancement that is coming soon. In the meantime, you can save a copy of the report in Neat by emailing a copy of your balance sheet to your Neat Cloud email-in address.
How do I create a Cash Flow Statement?
First click Reports at the top right hand corner of Neat.
Under the Financial Reporting section click Cash Flow Statement.
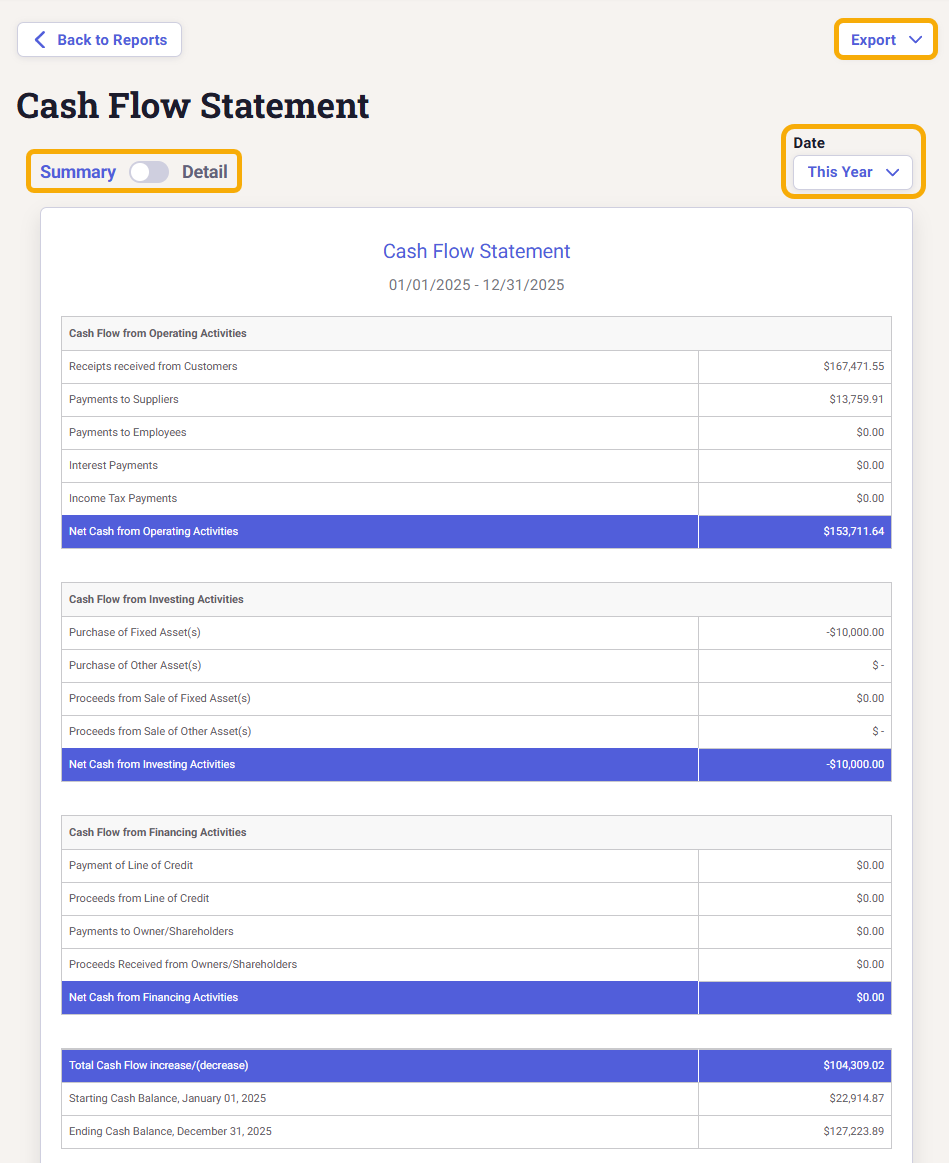
The Cash Flow Statement provides data on how cash flows in and out of your business for a specific date range. Your Cash Flow activities are divided into the following sections:
Cash Flow from Operating Activities: a list of operating activities that resulted in cash received or paid by the business.
Cash Flow from Investing Activities: a list of investing activities that include the purchase or sale of fixed and/or long-term assets.
Cash Flow from Financing Activities: a list of financing activities that include proceeds received from a loan or fixed liability and payments made to a loan or fixed liability.
Total Cash Flow increase/(decrease):
the calculated amount of the increase or decrease in cash for the report period.
Adjust the sheet's date by clicking on the date dropdown to the top right of the statement.
Toggle between a summary report, that presents the total for each of the Cash Flow activities, or a detailed report that presents a breakdown of the individual accounts and/or categories used to calculate the Cash Flow activity.
Click Export at the top right corner to export your statement to a PDF file, a CSV file, or to email the statement directly to your CPA or accountant.
Please Note: At this point, you cannot save a cash flow statement in Neat. This is a feature enhancement that is coming soon. In the meantime, you can save a copy of the report in Neat by emailing a copy of your balance sheet to your Neat Cloud email-in address.
How do I create a Transaction Detail Report?
First click Reports at the top right hand corner of Neat.
Under the Financial Reporting section click Transaction Detail. The Transactions Report provides a detailed list of ALL your streamed transactions from ALL your financial institutes including your adjustment entries. From the Transaction Detail Report, you can review and export your transactions to a CSV or PDF file together.
Filter your Transactions Report by Date, Vendor, Category, Reviewed Status, and Financial Account
Toggle Line Items to see a detailed export of your transactions
Click Export at the top right corner to export your report to a PDF file, a CSV file, or to email the statement directly to your CPA or accountant.
Click on the transaction's amount to preview and even edit and update your transaction.
Please Note: At this point, you cannot save a transaction detail report in Neat. This is a feature enhancement that is coming soon. In the meantime, you can save a copy of the report in Neat by emailing a copy of your balance sheet to your Neat Cloud email-in address.